pygmt.Figure.inset
- Figure.inset(position=None, width=None, height=None, box=False, no_clip=False, projection=None, region=None, verbose=False, **kwargs)
Manage figure inset setup and completion.
This method carves out a sub-region of the current plot canvas and restrict further plotting to that section of the canvas. Plotting methods that are called within the context manager are added to the inset figure.
Full GMT docs at https://docs.generic-mapping-tools.org/6.6/inset.html.
Aliases:
C = clearance
D = position, +w: width/height
F = box
J = projection
N = no_clip
R = region
V = verbose
- Parameters:
position (
Position|Sequence[float|str] |Literal['TL','TC','TR','ML','MC','MR','BL','BC','BR'] |None, default:None) –Position of the inset on the plot. It can be specified in multiple ways:
A
pygmt.params.Positionobject to fully control the reference point, anchor point, and offset.A sequence of two values representing the x- and y-coordinates in plot coordinates, e.g.,
(1, 2)or("1c", "2c").A 2-character justification code for a position inside the plot, e.g.,
"TL"for Top Left corner inside the plot.
If not specified, defaults to the Bottom Left corner of the plot.
height (
float|str|None, default:None) – Width and height of the inset. Width must be specified and height is set to be equal to width if not specified.box (
Box|bool, default:False) – Draw a background box behind the inset. If set toTrue, a simple rectangular box is drawn using MAP_FRAME_PEN. To customize the box appearance, pass apygmt.params.Boxobject to control style, fill, pen, and other box properties.clearance (float, str, or list) – This is clearance that is added around the inside of the inset. Plotting will take place within the inner region only. The margins can be a single value, a pair of values separated (for setting separate horizontal and vertical margins), or the full set of four margins (for setting separate left, right, bottom, and top margins). When passing multiple values, it can be either a list or a string with the values separated by forward slashes [Default is no margins].
no_clip (
bool, default:False) – Do not clip features extruding outside the inset frame boundaries [Default isFalse].projection (
str|None, default:None) – projcode[projparams/]width|scale. Select map projection.region (str or list) – xmin/xmax/ymin/ymax[+r][+uunit]. Specify the region of interest.
verbose (bool or str) – Select verbosity level [Full usage].
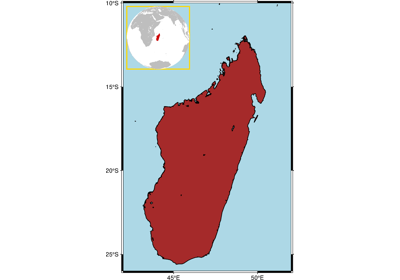
Examples
>>> import pygmt
>>> from pygmt.params import Box, Position
>>>
>>> fig = pygmt.Figure()
>>> fig.coast(region="MG+r2", water="lightblue", shorelines="thin")
>>> # Use a "with" statement to initialize the inset context manager.
>>> # Setting the position to Top Left and a width of 3.5 centimeters
>>> with fig.inset(
...     position=Position("TL", offset=0.2),
...     width="3.5c",
...     clearance=0,
...     box=Box(pen="green"),
... ):  # Map elements under the "with" statement are plotted in the inset
...     fig.coast(
...         region="g",
...         projection="G47/-20/?",
...         land="gray",
...         water="white",
...         dcw="MG+gred",
...     )
>>> # Map elements outside the "with" statement are plotted in the main figure
>>> fig.logo(position=Position("BR", offset=0.2), width="3c")
>>> fig.show()